1
A band for every area
For each neighbourhood, we show you a crime band, derived from crimes recorded by the police over the last 12 months per 1,000 residents.
Below average for London
Average for London
Above average for London
Our bands are specific to their city, with each band containing one third of the neighbourhoods, so it is a city measure, not a national one.
3
Your own limit
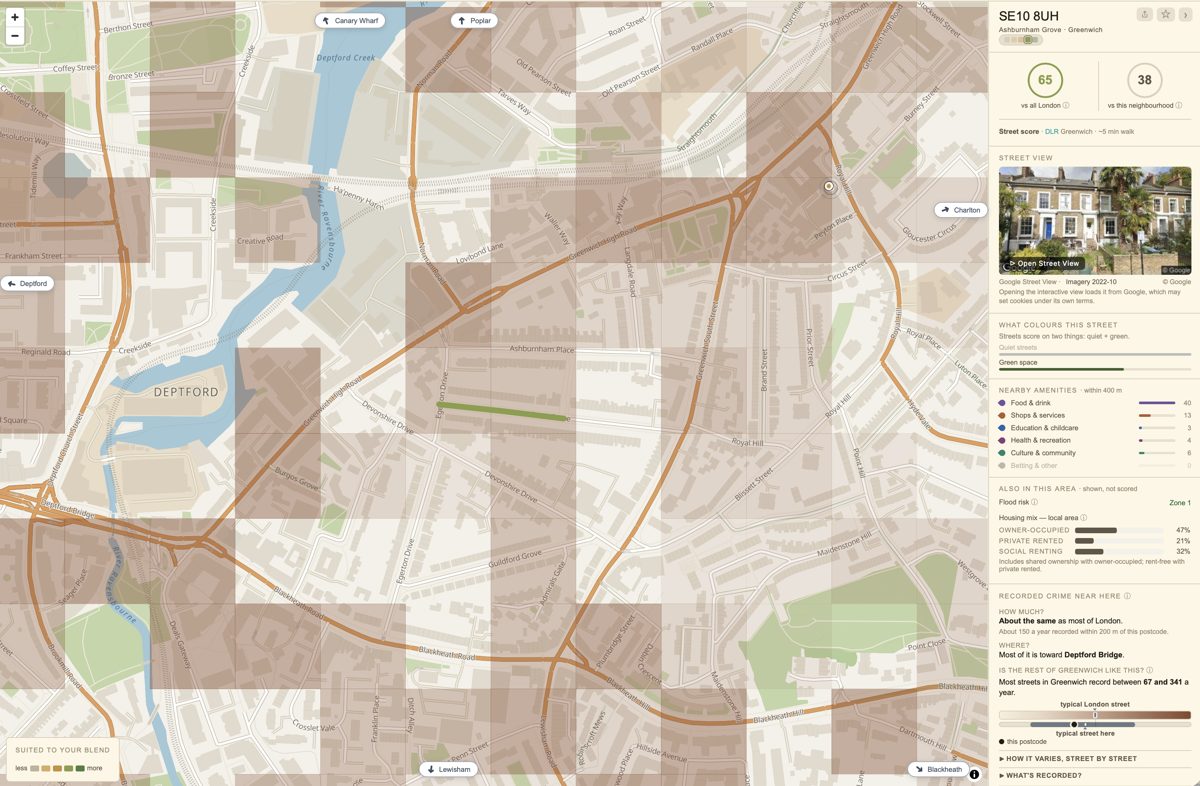
You choose the level that you are comfortable with and the map adjusts accordingly. Any areas past your chosen limit fade out on the map rather than disappear fully — so you can still see what’s been excluded.
I won’t take an area where the typical street records more than this
"Typical street" means the middle one of the area's own postcodes, counted within 200 metres and compared with every street in the city.